Sirannon benchmarks
The benchmark measures what Sirannon and PostgreSQL each do under the same standard OLTP workloads. The figures and tables give the rate each engine held, its tail latency at that rate, and the rate where it stopped keeping up. PostgreSQL is the server most applications would otherwise use, so readers can weigh Sirannon's figures against a familiar reference.
Both engines run on one host as native processes pinned to dedicated cores under a hard memory ceiling, each driven through the client it provides, at matched durability, under an open-loop load generator that records the full tail latency.
The numbers on this page come from the latest committed run under benchmarks/server/results/runs/. The prose is written by hand; every table and the machine description come from that run, so the words and the numbers match. When no run is committed, the page shows a placeholder instead of numbers.
Methodology
One Node load generator drives both databases, with a thin per-database adapter for each. Sirannon runs over its SDK's default WebSocket transport, which multiplexes every concurrent request over one persistent socket; PostgreSQL runs over node-postgres on its binary socket protocol. Both engines answer on the same host over loopback. Sirannon's WebSocket path carries JSON framing on every call, heavier than PostgreSQL's binary protocol, and the numbers include that cost because it is Sirannon's client path. Before each sweep the generator measures each client's own throughput ceiling against the live engine and records it with the results, so a rate that falls short reflects the database's limit.
Both engines run as native processes under Linux cgroup v2 control. The engine under test is pinned to its own CPU cores with a hard memory ceiling, sized so the dataset cannot be served from RAM alone, and the load generator runs on disjoint cores with no memory cap. Each engine writes to a data directory the harness first proves, at device level, to be on the machine's local NVMe. The engines run one after the other, each engine process starts fresh for its pass and is stopped after it, so neither engine carries a warm buffer pool between passes, and Sirannon's data directory is removed after each of its passes. Between passes the harness applies a disclosed cooldown: it syncs and waits for dirty pages to drain, trims the data filesystem, and pauses for a fixed interval. The operating system page cache is dropped before each measured series, so neither engine starts warm from the other's run.
The harness matches durability at two levels. Full durability sets PostgreSQL synchronous_commit=on against Sirannon synchronous=full, so both fsync every commit. Matched-relaxed sets synchronous_commit=off against Sirannon synchronous=normal in WAL mode, so both defer the fsync and both can lose only the most recent commits on power loss without corrupting.
The load is open-loop. Requests arrive at a fixed target rate whether or not earlier requests have returned, and each request's latency counts from the time it was meant to be sent, which corrects for coordinated omission. The report uses tail-latency percentiles, and the operating point is the highest offered rate the engine sustained while holding p99 under the recorded target.
The sweep's measured windows are short, so on selected workloads the harness then holds each engine at its operating point for one long continuous window that crosses both engines' checkpoint cycles, and reports the pace and tail latency of every 30-second slice of it. This shows whether the operating point survives the periodic housekeeping both engines defer, which a short window cannot contain.
The run
- Run. These figures come from run
20260804T221053Z, recorded on 2026-08-04 from commit650df41c6b3a. The full per-run report is in the run report. - Machine. The run executed on GCP c3-standard-8-lssd, us-central1-b, which reports Intel(R) Xeon(R) Platinum 8481C CPU @ 2.70GHz with 8 logical cores, 31.3 GB of memory, on Linux 6.17.0-1021-gcp (x64).
- Engines. Sirannon 0.2.2 (storage engine SQLite 3.53.4); PostgreSQL 17.10. Both run as native processes on dedicated cores under a 2G memory ceiling (cgroup v2), at Full durability (fsync every commit) and Matched-relaxed (deferred fsync).
- Delivery. One Node load generator drove both engines through the client each provides: Sirannon over its SDK's WebSocket transport, which multiplexes every request over one persistent socket, and PostgreSQL over node-postgres on its binary socket protocol, both on one host over loopback. Each engine ran on 4 pinned cores and the load generator on 4 of its own.
- Load-client headroom. Run on its own against the live engines, the Sirannon SDK sustained 110.3K and node-postgres 41.3K, 1.72x and 0.64x the fastest rate offered. Each client stays above the operating points its engine reached, so every reported operating point reflects the database's speed. A client below 1.00x could not offer the very top rate of the sweep, and the rates above its ceiling measure the client rather than the engine.
- Workloads. Every workload ran at 10,000,000 rows, sweeping target rates drawn from 1,000, 2,000, 4,000, 8,000, 16,000, 32,000, and 64,000 requests per second. Each engine climbs the list until it fails to sustain a rate, runs one more rate, and stops, so the two engines can end their sweeps at different rates, with a 3 s warmup and a 10 s measurement window under seed
42. Every rate ran 5 independent times, and each figure is the median with a 95% confidence interval. The service-level target for the operating point is a p99 under 25 ms. - Soak. After the sweep, YCSB-A (50/50 read/update) and TPC-C-derived held each engine at its operating point for one continuous 20-minute window, reported in 30-second slices.
- Writer deadline. Sirannon ran with its writer deadline disabled, matching PostgreSQL's
statement_timeoutdefault, so a slow write was never reported as a stalled one. The workload stall deadline and the per-pass timeout still bound a wedged engine. The schema reset between workloads ran under a 30-minute request limit, because dropping a table of this size takes minutes of random reads.
Operating points
An engine's operating point is the highest offered request rate at which it held p99 latency under the disclosed target. Where an engine delivered a higher rate with p99 above the target, its operating point is the lower rate it last held. So an operating point can be well below the rate the engine served. The ratio column holds one operating point divided by the other, and a difference in tail latency therefore reads as a difference in rate. The sweep figures and tables further down give every rate each engine ran, including the rates above its operating point.
Full durability (fsync every commit)
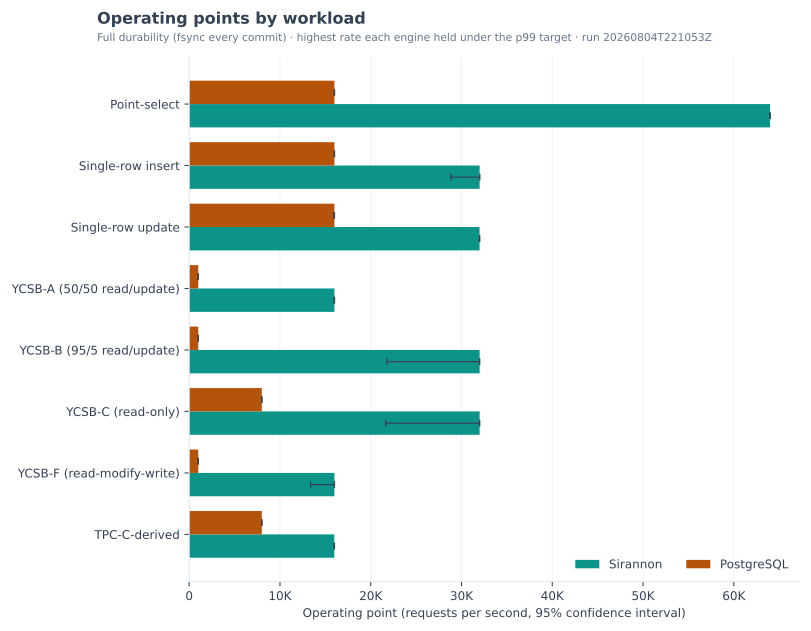
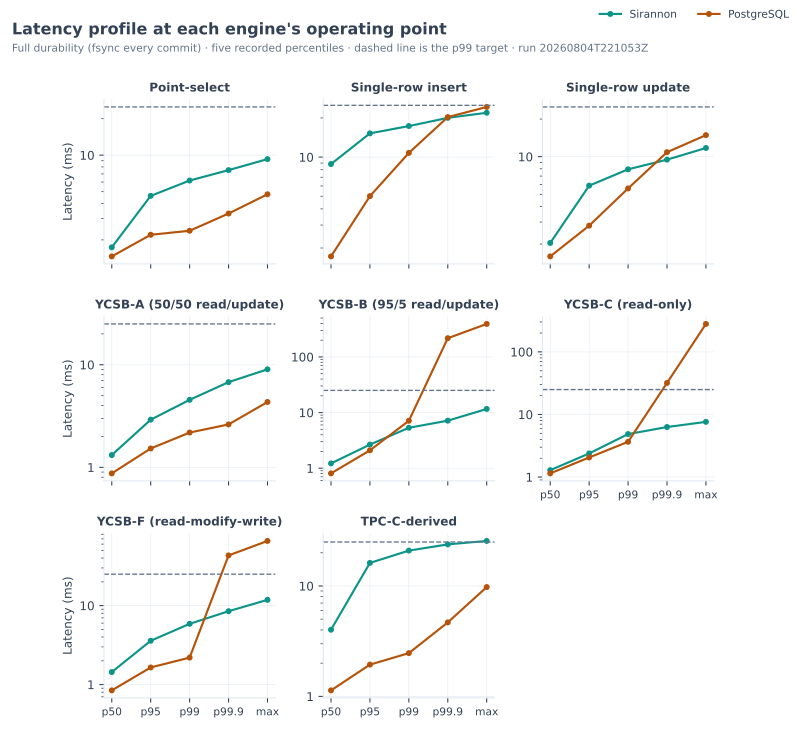
| Workload | Sirannon ops/s | Sirannon 95% CI | Sirannon CV | Sirannon p99 ms | Postgres ops/s | Postgres p99 ms | Rate ratio |
|---|---|---|---|---|---|---|---|
| Point-select | 64.0K | [64.0K, 64.0K] | 0.0% | 6.177 | 16.0K | 2.378 | 4.00x [4.00x, 4.00x] |
| Single-row insert | 32.0K | [28.8K, 32.0K] | 4.5% | 17.331 | 16.0K | 10.770 | 1.96x [1.88x, 2.00x] |
| Single-row update | 32.0K | [32.0K, 32.0K] | 0.0% | 7.928 | 16.0K | 5.574 | 2.00x [2.00x, 2.00x] |
| YCSB-A (50/50 read/update) | 16.0K | [16.0K, 16.0K] | 0.0% | 4.551 | 1.0K | 2.184 | 16.00x [16.00x, 16.00x] |
| YCSB-B (95/5 read/update) | 32.0K | [21.8K, 32.0K] | 15.3% | 5.336 | 1000 | 7.119 | 29.96x [25.87x, 32.00x] |
| YCSB-C (read-only) | 32.0K | [21.7K, 32.0K] | 15.5% | 4.865 | 8.0K | 3.664 | 3.74x [3.22x, 4.00x] |
| YCSB-F (read-modify-write) | 16.0K | [13.4K, 16.0K] | 7.6% | 5.881 | 1.0K | 2.196 | 15.47x [14.42x, 16.00x] |
| TPC-C-derived | 16.0K | [16.0K, 16.0K] | 0.1% | 20.912 | 8.0K | 2.466 | 2.00x [2.00x, 2.00x] |
Matched-relaxed (deferred fsync)
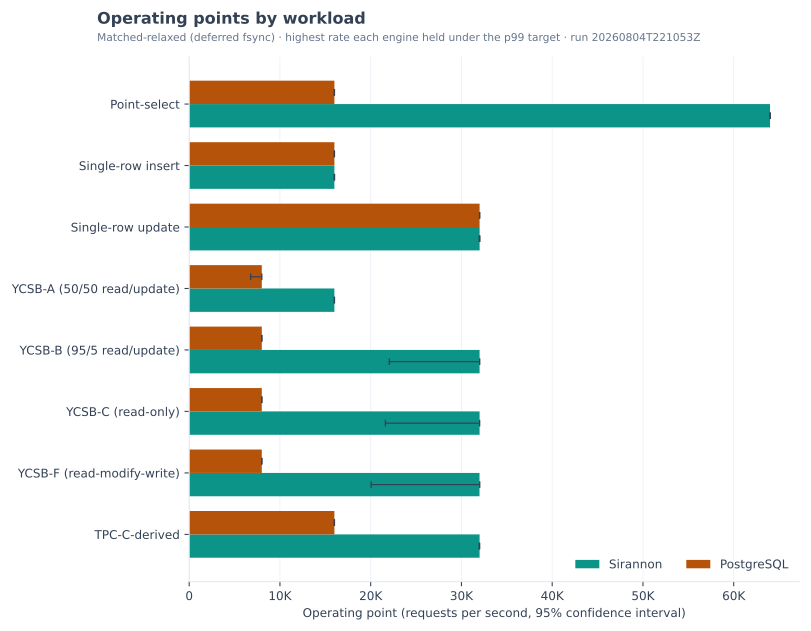
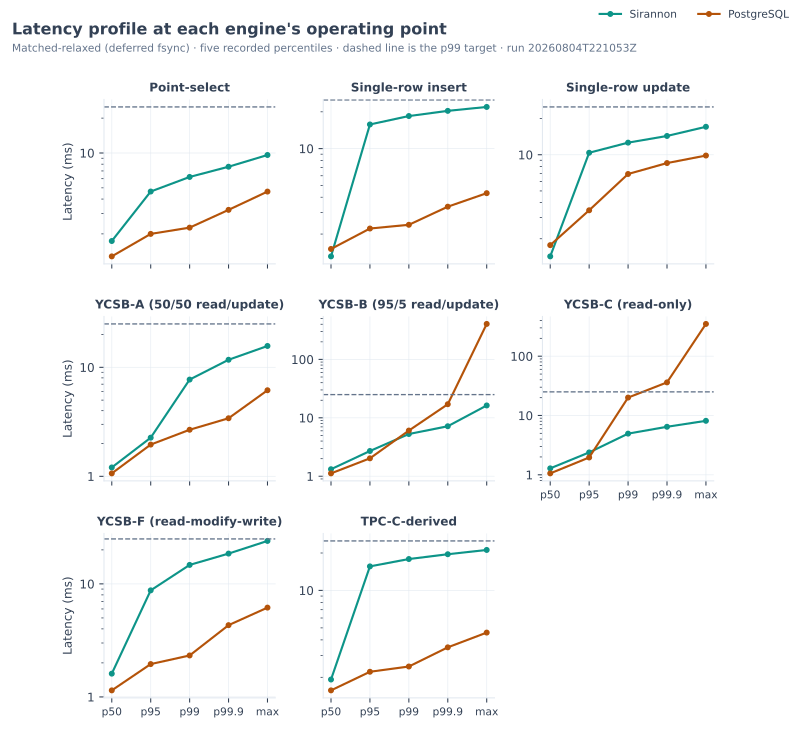
| Workload | Sirannon ops/s | Sirannon 95% CI | Sirannon CV | Sirannon p99 ms | Postgres ops/s | Postgres p99 ms | Rate ratio |
|---|---|---|---|---|---|---|---|
| Point-select | 64.0K | [64.0K, 64.0K] | 0.0% | 6.208 | 16.0K | 2.266 | 4.00x [4.00x, 4.00x] |
| Single-row insert | 16.0K | [16.0K, 16.0K] | 0.1% | 18.458 | 16.0K | 2.381 | 1.00x [1.00x, 1.00x] |
| Single-row update | 32.0K | [32.0K, 32.0K] | 0.1% | 12.613 | 32.0K | 6.917 | 1.00x [1.00x, 1.00x] |
| YCSB-A (50/50 read/update) | 16.0K | [16.0K, 16.0K] | 0.0% | 7.718 | 8.0K | 2.675 | 2.06x [2.00x, 2.20x] |
| YCSB-B (95/5 read/update) | 32.0K | [22.0K, 32.0K] | 14.8% | 5.283 | 8.0K | 6.054 | 3.75x [3.25x, 4.00x] |
| YCSB-C (read-only) | 32.0K | [21.6K, 32.0K] | 15.5% | 4.948 | 8.0K | 20.059 | 3.74x [3.22x, 4.00x] |
| YCSB-F (read-modify-write) | 32.0K | [20.1K, 32.0K] | 18.0% | 14.719 | 8.0K | 2.326 | 3.70x [3.10x, 4.00x] |
| TPC-C-derived | 32.0K | [32.0K, 32.0K] | 0.1% | 17.878 | 16.0K | 2.443 | 2.00x [2.00x, 2.00x] |
Bold marks the higher of the two operating points on each workload. Where both engines held the target at the same rate, the row carries no mark. Each p99 belongs to its own engine's operating point, so the two p99 columns describe different offered rates, and the sweep figures below give tail latency at one rate.
Each throughput figure is the median of several independent runs at the operating point, the highest offered rate the engine held under the p99 target, shown with a 95% bootstrap confidence interval and the run-to-run coefficient of variation. The rate ratio is Sirannon's operating point divided by PostgreSQL's. A ratio above one means Sirannon held the target at a higher rate. Where an engine delivered a higher rate with p99 above the target, its operating point is the lower rate it last held, so a ratio compares operating points rather than the work each engine performed. Read every ratio as approximate too, because the sweep offers rates in doublings and each operating point is the last rung an engine cleared, so its true ceiling lies between that rung and the next. The sweep figures below give the rungs themselves. TPC-C-derived is a TPC-C-shaped mix of new-order and payment, not an audited TPC-C result. The YCSB subset is A, B, C, and F, and leaves out D and E.
Throughput versus offered load
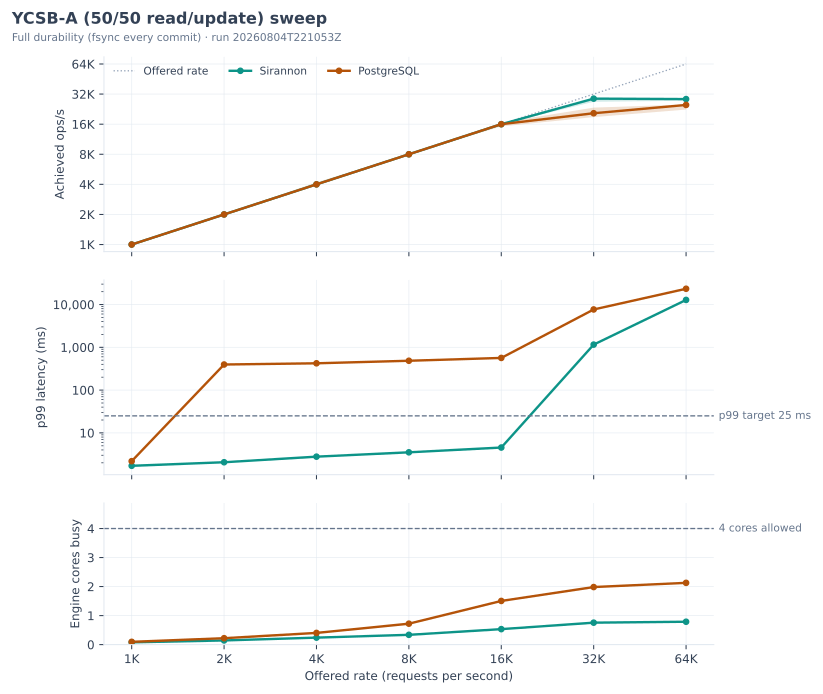
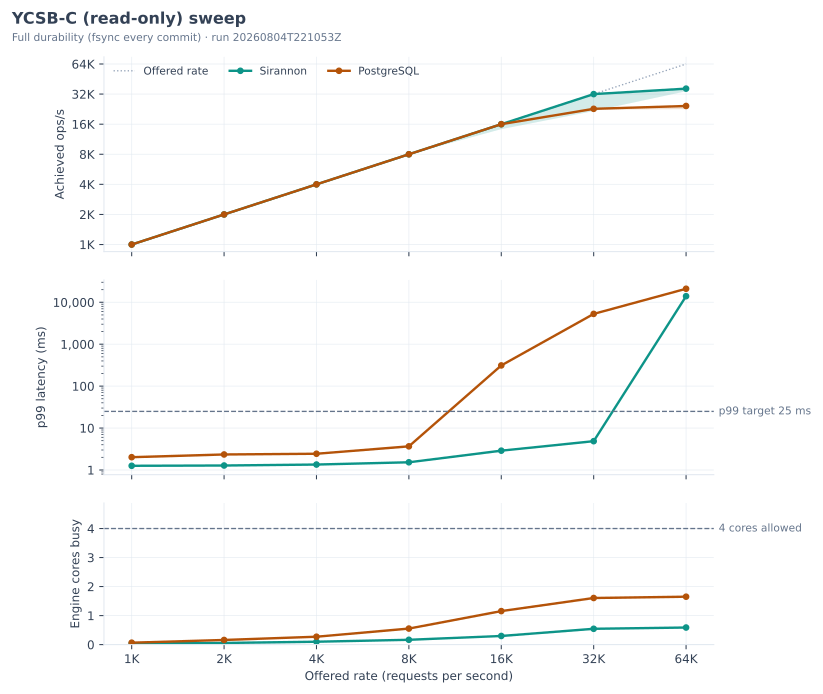
Each figure below plots achieved throughput, p99 latency, and engine cores busy as the offered rate climbs, and the table under it gives the same rungs as numbers. Read the middle panel for the rate at which each engine's tail latency breaks down.
Each figure and table below covers one workload at full durability (fsync every commit), as the offered rate climbs. PostgreSQL relies on row-level locking and Sirannon on a single writer, so which one holds throughput as the rate rises depends on the workload. The dotted line on the top panel is the offered rate, so a curve leaving it marks the point where that engine stopped keeping up.
Both engines answer the same offered rate on every row, so bold marks the better figure of the two: the higher achieved throughput and the lower p99. Where the two figures are equal, the row carries no mark.
YCSB-A (50/50 read/update)
| Target ops/s | Sirannon ops/s | Sirannon p99 ms | Postgres ops/s | Postgres p99 ms |
|---|---|---|---|---|
| 1,000 | 1.0K | 1.703 | 1.0K | 2.184 |
| 2,000 | 2.0K | 2.062 | 2.0K | 396 |
| 4,000 | 4.0K | 2.784 | 4.0K | 423 |
| 8,000 | 8.0K | 3.517 | 8.0K | 485 |
| 16,000 | 16.0K | 4.551 | 16.0K | 565 |
| 32,000 | 28.8K | 1,157 | 20.6K | 7,666 |
| 64,000 | 28.5K | 12,813 | 24.9K | 23,355 |
YCSB-C (read-only)
| Target ops/s | Sirannon ops/s | Sirannon p99 ms | Postgres ops/s | Postgres p99 ms |
|---|---|---|---|---|
| 1,000 | 1.0K | 1.259 | 1.0K | 2.019 |
| 2,000 | 2.0K | 1.279 | 2.0K | 2.344 |
| 4,000 | 4.0K | 1.348 | 4.0K | 2.439 |
| 8,000 | 8.0K | 1.527 | 8.0K | 3.664 |
| 16,000 | 16.0K | 2.890 | 16.0K | 312 |
| 32,000 | 32.0K | 4.865 | 22.8K | 5,290 |
| 64,000 | 36.3K | 13,988 | 24.3K | 21,041 |
The same three-panel figure is drawn for every workload at both durability levels, in benchmarks/server/results/runs/20260804T221053Z/charts/.
Holding the operating point
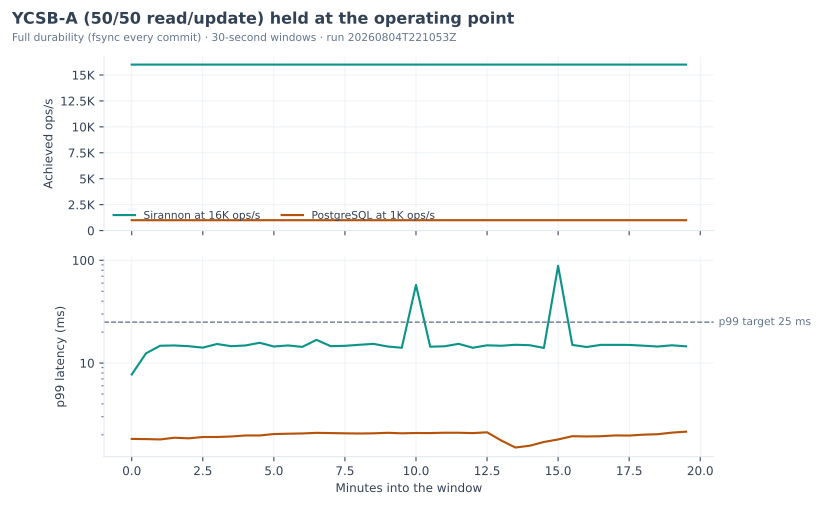
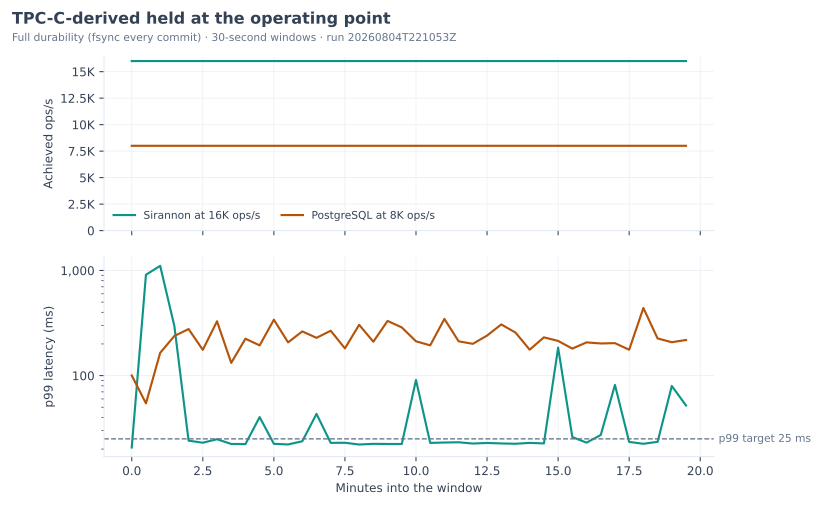
An operating point found in short windows is only proven when the engine holds it through its periodic housekeeping, so this section holds each engine at that rate for one long continuous window and shows the slowest slice of it.
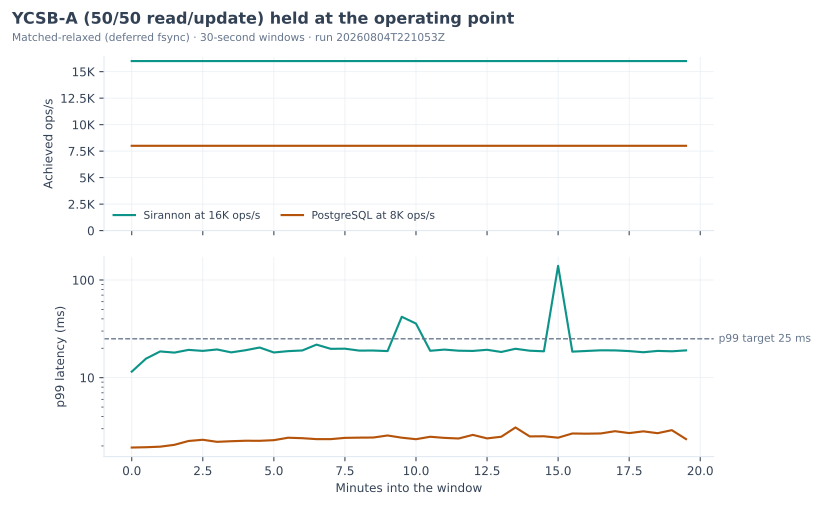
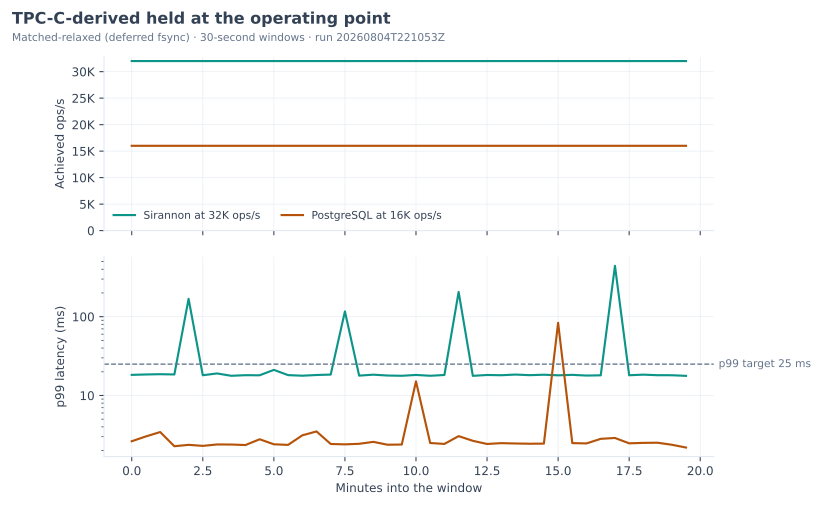
The sweep measures in short windows, so this section holds each engine at its operating point for one long continuous window instead. The window is long enough to cross both engines' checkpoint cycles, and the worst-30-second column shows the slowest slice of it, which is where a checkpoint stall appears. Each figure plots every window in order, so a periodic stall reads as a spike and a steady cost reads as a raised floor. An engine holds when it keeps at least 95% of the rate with under 1% errors and a p99 under the service-level target across the whole window, so an engine that keeps the pace but misses the latency target reads as a miss. Bold marks the higher rate of the two engines on a workload. It also marks the engine that held where only one of the two held. Each engine ran this window at its own operating point, so the latency columns carry no mark.
Full durability (fsync every commit)
| Workload | Engine | Rate held | Achieved | p99 ms | Worst 30 s p99 | Errors | Held |
|---|---|---|---|---|---|---|---|
| YCSB-A (50/50 read/update) | Sirannon | 16,000 | 16.0K | 14.876 | 88.210 | 0.0% | yes |
| YCSB-A (50/50 read/update) | PostgreSQL | 1,000 | 1000 | 1.977 | 2.149 | 0.0% | yes |
| TPC-C-derived | Sirannon | 16,000 | 16.0K | 867 | 1,107 | 0.0% | no |
| TPC-C-derived | PostgreSQL | 8,000 | 8.0K | 237 | 440 | 0.0% | no |
Matched-relaxed (deferred fsync)
| Workload | Engine | Rate held | Achieved | p99 ms | Worst 30 s p99 | Errors | Held |
|---|---|---|---|---|---|---|---|
| YCSB-A (50/50 read/update) | Sirannon | 16,000 | 16.0K | 19.263 | 140 | 0.0% | yes |
| YCSB-A (50/50 read/update) | PostgreSQL | 8,000 | 8.0K | 2.428 | 3.090 | 0.0% | yes |
| TPC-C-derived | Sirannon | 32,000 | 32.0K | 18.587 | 442 | 0.0% | yes |
| TPC-C-derived | PostgreSQL | 16,000 | 16.0K | 2.550 | 83.647 | 0.0% | yes |
Sirannon-only characterizations
These measure Sirannon on its own terms, because PostgreSQL either has no built-in equivalent or reaches the same goal a different way.
Cold start
This is the time from the process start command to the first successful health probe, measured the same way for both engines. Bold marks the faster start.
| Engine | Cold start ms |
|---|---|
| Sirannon | 197 |
| PostgreSQL | 175 |
Change-feed latency (Sirannon only)
This measures the lag from a committed write to the change reaching a subscriber over Sirannon's built-in WebSocket feed. The server polls the change log every 50 ms, so that interval is the floor. PostgreSQL has no built-in change feed, so these numbers describe Sirannon on its own.
| Samples | p50 ms | p95 ms | p99 ms | max ms |
|---|---|---|---|---|
| 200 | 50.998 | 51.157 | 51.226 | 51.770 |
Reproducing this
The harness is in benchmarks/server/, and its README explains the method, the durability matching, the coordinated-omission correction, and how to run the suite on the benchmark VM or against a hand-started server. To publish credible numbers, run it on the disclosed cloud machine through benchmarks/cloud/.